Semantic Model
The EdGraph Content Pack uses the Semantic Model as its data source, and is essentially a PBIX file that opens within Power BI.
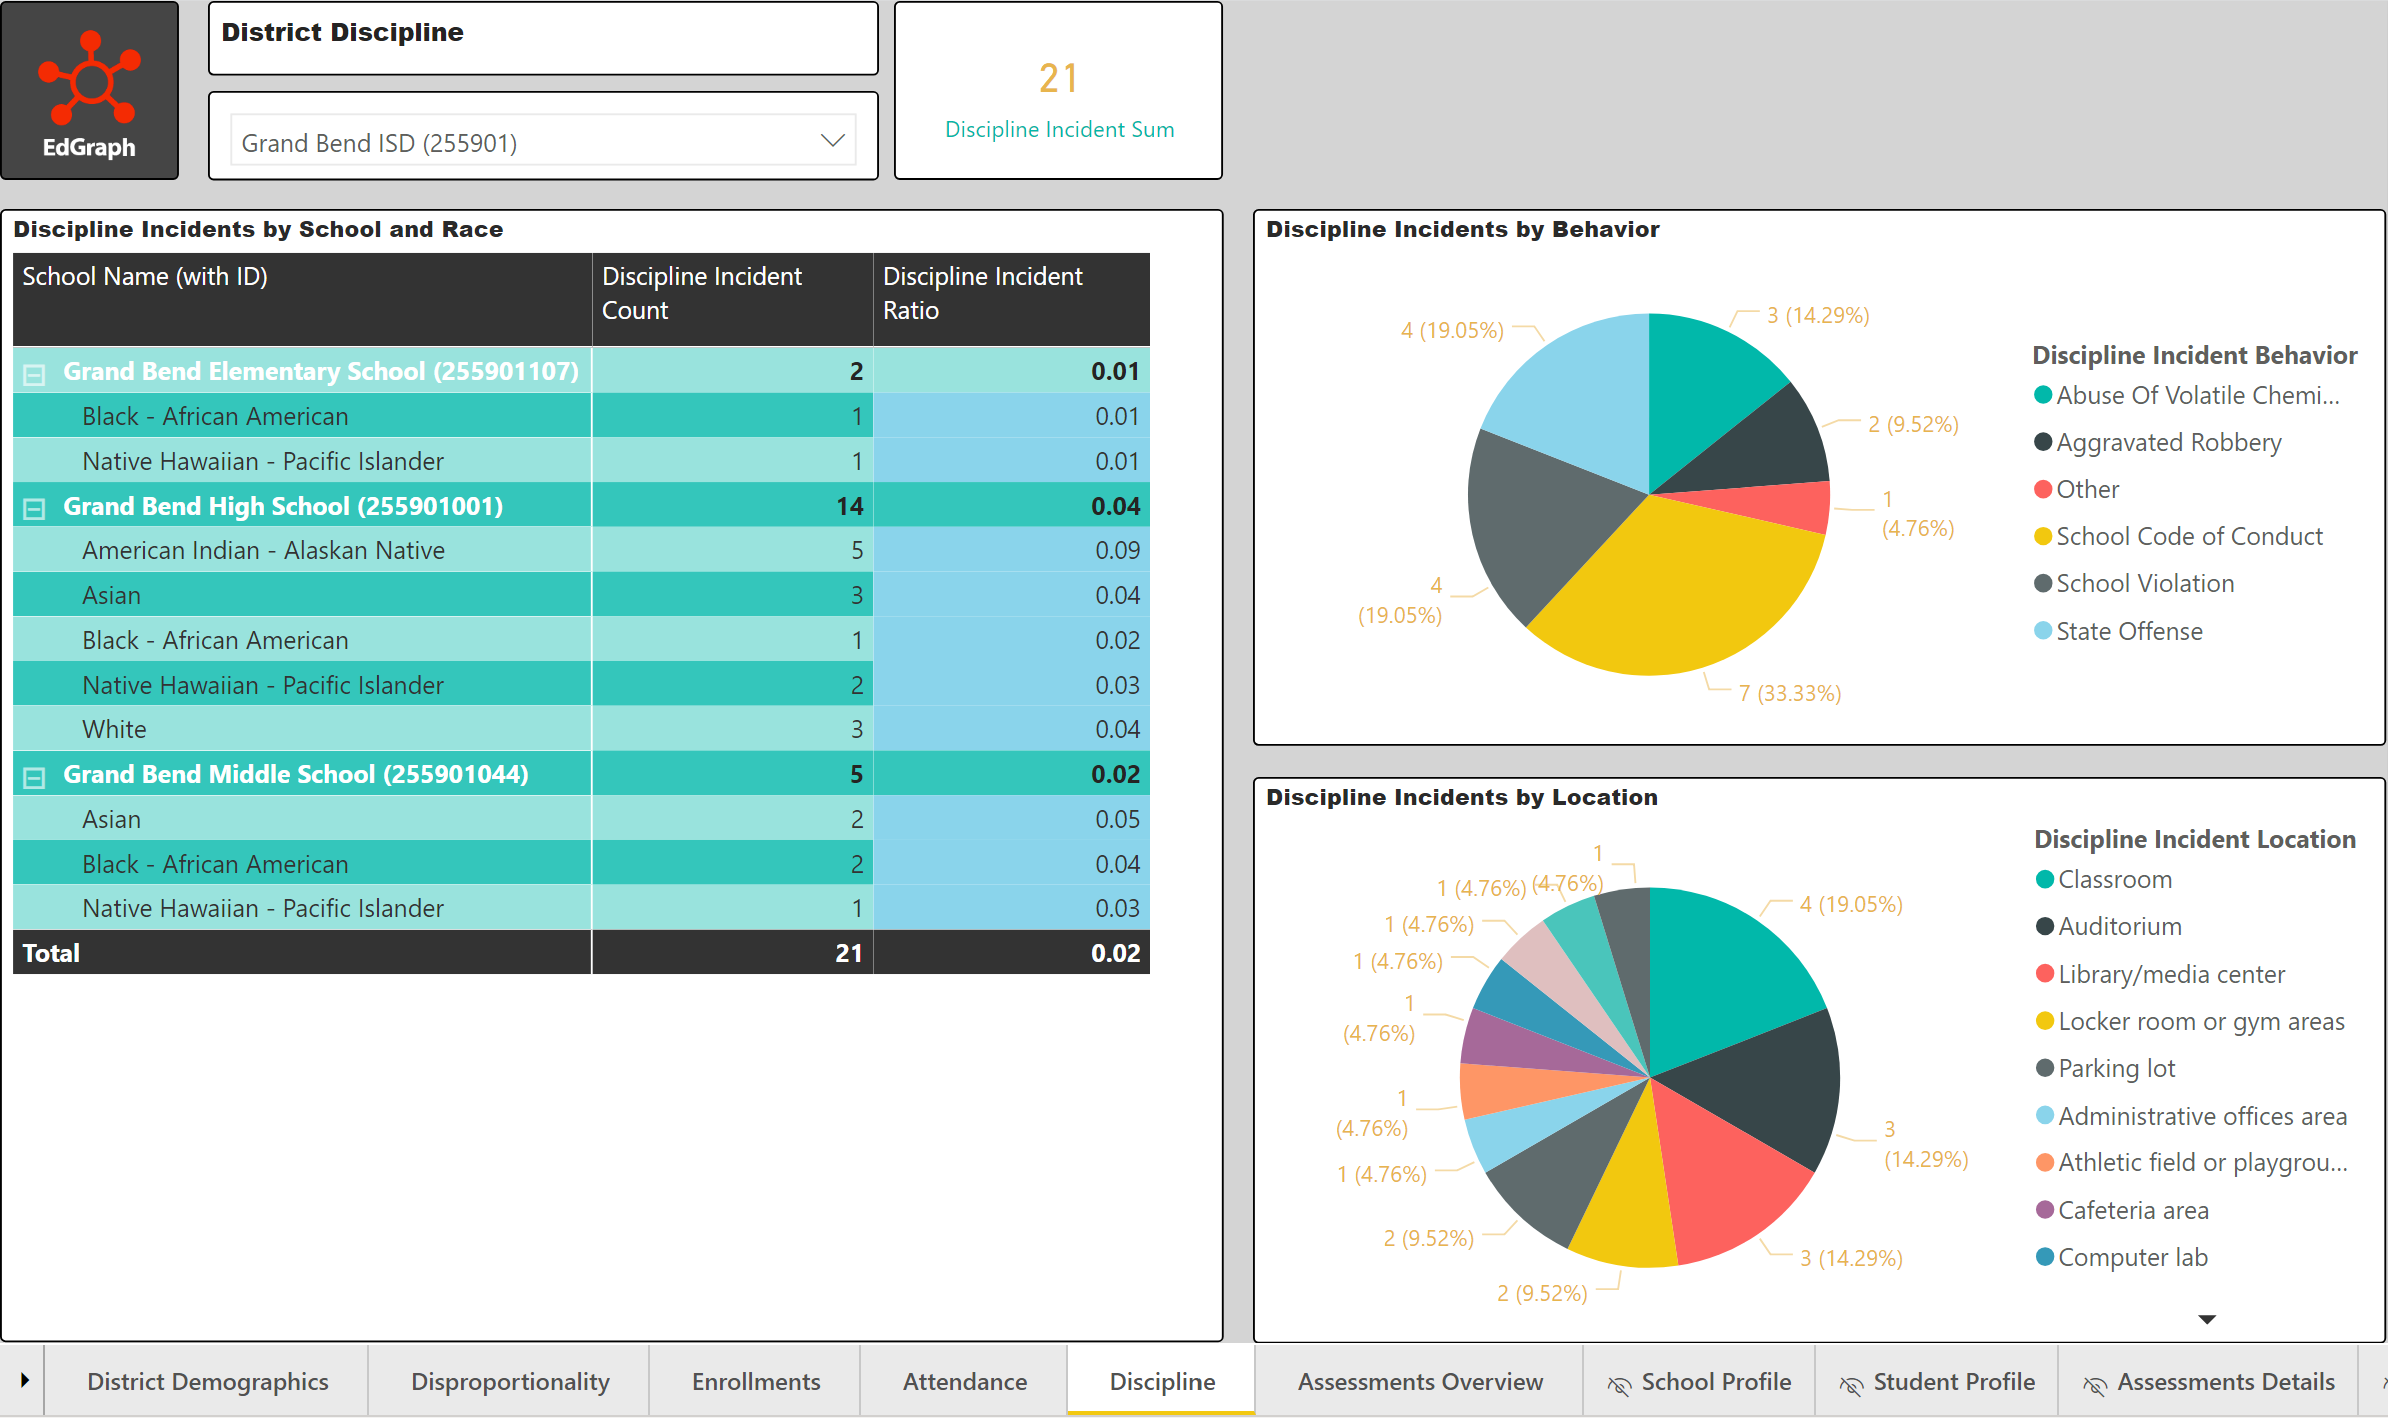
Below is a sample dashboard. Along the bottom, whether accessed via Power BI Desktop or PowerBI.com, there are tabs that allow the user to navigate through the different available dashboards/reports.
There are two usage scenarios - that of a user and an author. Authors are able to edit the Content Pack and deploy to...
- a Power BI Report Server (on-premise, Power BI Mobile access)
- Power BI Embedded (for publishing within the EdGraph Platform)
- PowerBI.com (cloud/Office 365).
NOTE: available deployment options may vary depending on the hosting decisions of the organization.
Users can simply view existing dashboards for their role, but not make any modifications.
Regardless of role, at the top right corner of Power BI Report Server (for on-premise installations of EdGraph) and PowerBI.com (for cloud-based installations) there are some helpful menus.
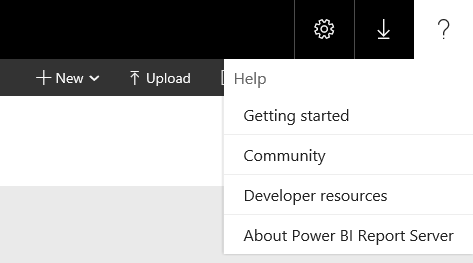
The "?" icon houses a list of available documentation, providing helpful context-aware articles for both users and authors --
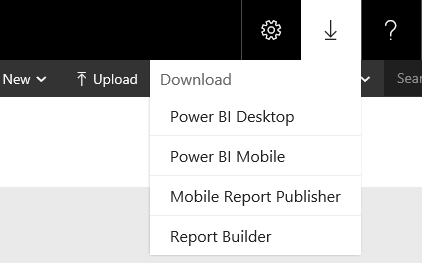
The downward arrow icon houess a list of available downloads. From here authors can download Power BI Desktop, Report Builder, etc... --